EV Charging Losses: Why Billed kWh Exceed Battery Energy
Your charger receipt and battery percentage measure different things. Learn where charging energy goes and how to calculate realistic EV charging costs in Canada.
Quick Verdict
Budget using the energy you buy, not just the energy your battery appears to gain. A charger can supply 50 kWh while the battery stores less, without either the receipt or the vehicle necessarily being wrong. Conversion losses, active electronics and battery heating or cooling account for energy that does not become additional stored charge.
For Canadians comparing home charging with public stations, the useful number is total charging cost for the driving you actually do. At home, use charging-related electricity measured at a known point and the applicable electricity rate. At a public charger, use the billed kWh and the actual tariff, plus any separate fees.
The caveat: there is no universal charging-loss percentage. Vehicle, charging equipment, temperature and session conditions matter. A dashboard percentage multiplied by the battery’s advertised capacity is not a precision audit of the charger.
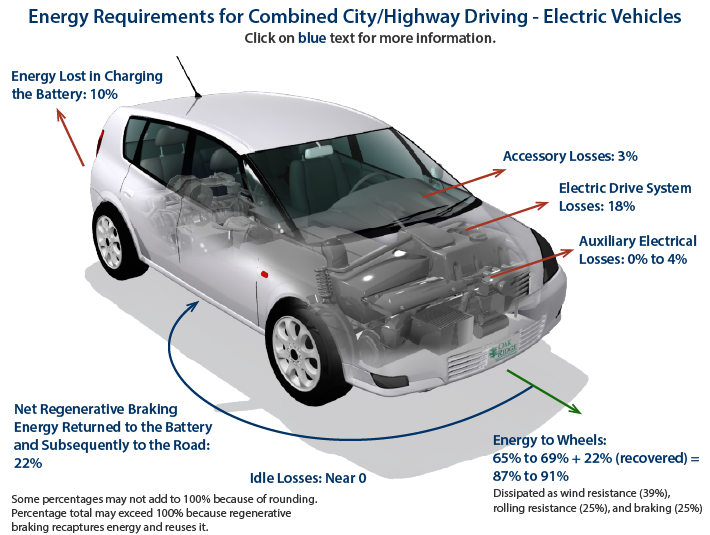
Official illustration: FuelEconomy.gov, U.S. Department of Energy and Environmental Protection Agency. Its energy-flow estimates are primarily based on analysis of a 2012 Nissan LEAF; the diagram’s 10% charging-loss figure is not a universal rate for today’s EVs.
One Charging Session, Different Energy Totals
It helps to separate three quantities:
- Electricity taken from the grid. At home, the household meter measures electricity before it reaches the vehicle, alongside other household use.
- Energy measured for the charging session. A charger or app reports energy at its own measurement point. Read its documentation and the operator’s billing terms rather than assuming every display measures the same boundary.
- Energy added to the battery. This is the increase in stored energy, not necessarily all the energy the vehicle received.
The distinction matters especially when comparing AC and DC charging. With alternating-current (AC) charging at home, the vehicle’s onboard charger converts AC electricity into direct current (DC) for the battery. At a DC fast charger, that conversion takes place in the charging equipment outside the car.
Moving the conversion equipment does not make conversion losses disappear. It changes where they occur. Do not assume a public station bills you for every kWh drawn at its upstream grid connection; check the operator’s stated billing basis.
The U.S. government’s FuelEconomy.gov energy-flow explanation identifies AC-to-DC conversion and resistance during battery charging as sources of loss. It also explicitly notes that charging losses vary with the vehicle, charging system, battery state and weather.
Where the Extra Energy Goes
Read the boundaries, not just the percentages. This historical government diagram separates charging from driving losses. Its figures illustrate energy flow, not the measured performance of a current Canadian vehicle.
Some energy becomes heat in conversion equipment, wiring and the battery. Some runs the electronics controlling the session. Some may heat or cool the battery to keep it within its operating requirements.
That last category is particularly relevant as Canadian temperatures fall. Energy spent bringing a cold battery up to temperature is not evidence that the charging station has miscounted. It is energy used for a necessary vehicle function rather than a net increase in stored charge.
German motoring organization ADAC’s charging-loss measurements illustrate why the charging setup matters. In its published AC test, five vehicles showed 5.1% to 7.0% losses at 11- or 22-kW wallbox charging, compared with 12.7% to 24.2% at a household socket.
Those results are European test findings, not a forecast for Canadian Level 1 charging. ADAC’s household-socket test used a nominal 2.3-kW supply; Canada’s common 120-volt charging setup is different. Its AC measurements also started with batteries at 20–30°C and stayed within a 10–90% state-of-charge window. They are not a Canadian winter benchmark.
The useful engineering lesson travels better than the exact percentages: electronics that remain active throughout a slow charge consume energy for longer. A low charging rate is not automatically the most energy-efficient one.
Our Level 1 versus Level 2 home-charging guide covers the practical equipment choice. Efficiency alone does not establish that a new electrical installation will pay for itself; installation cost, driving demand and the electricity tariff still matter.
The Cost Calculation: Divide, Do Not Just Add
Consider an illustrative session in which you want to add 45 kWh to the battery and 90% of the incoming energy is stored.
The input energy required is:
45 kWh ÷ 0.90 = 50 kWh.
At a hypothetical CAD $0.15/kWh electricity rate, that energy costs CAD $7.50, before any applicable taxes or other charges. Multiplying only the 45 kWh stored by the rate would give CAD $6.75 and understate the energy bill.
There is a small but important arithmetic trap here. A 10% loss of incoming energy does not mean buying just 10% more than the desired battery gain. You buy approximately 11.1% more, because 45 ÷ 0.90 is 50, not 49.5.
This example is not a measured loss rate or a claim about any Canadian utility tariff. Use it to understand the calculation, then substitute a measured efficiency for your setup if one is available.
For a public session billed per kWh, the simplest calculation remains billed kWh × posted rate, with taxes, session charges, parking or idle fees handled separately. You do not need to reconstruct battery storage to check that multiplication. Our Canadian charging-price guide explains why per-minute billing requires a different comparison.
Why Battery Percentage Is a Rough Cross-Check
Suppose an EV moves from 20% to 80%. Multiplying that 60-percentage-point rise by an advertised battery capacity can produce a rough estimate, but not a calibrated measurement of added energy.
First, check whether the published capacity is gross or usable. They are not interchangeable. The dashboard percentage is an estimate of state of charge, and its displayed precision is limited. Using a rounded percentage and an unsuitable capacity figure can make the apparent mismatch larger or smaller.
Also distinguish kW from kWh. A charger marked 350 kW describes a maximum power capability, not the amount of energy it promises to add. A receipt showing 50 kWh describes energy delivered according to the session’s measurement, not a charging speed.
For the same reason, do not assume every published consumption rating excludes charging losses. Check the rating’s test method before adding a blanket loss allowance. A wall-energy figure and an in-car driving-consumption display can use different boundaries; adding losses to a figure that already includes them double-counts the penalty.
Winter Preconditioning Moves Energy Use, Not Physics
Battery preconditioning can prepare an EV to accept a useful fast-charging rate. But a warmer battery does not arrive at the charger for free.
In ADAC’s DC testing, warming the battery during the drive reduced the need to heat it at the station. The organization cautions that this saves time at the stop, not the heating energy itself: that energy has already been used on the way.
That is not a reason to disable the manufacturer’s recommended charging preparation. It is a reason to judge the whole journey rather than celebrating a smaller gap on one charging receipt. A session can look more efficient because some preparation happened before the cable was connected.
Follow your vehicle’s supported preconditioning procedure. Our battery-preconditioning guide explains the distinction between preparing the battery for fast charging and simply warming the cabin.
How to Check Your Own Costs
- Choose a measurement boundary. At home, identify whether the figure comes from the electricity meter, a charging-circuit meter or the wallbox. Do not treat the whole household bill as vehicle consumption.
- Compare several similar sessions. Record supplied or billed kWh, charge percentages, temperatures and whether battery or cabin heating ran. One short cold-weather top-up can be unrepresentative.
- Use the actual tariff. Time-of-use rates can make a slightly less efficient session cheaper. Efficiency and cost are related, but they are not the same objective.
- Investigate persistent unexplained changes. Save receipts and ask the operator or vehicle service team to review an unusual pattern. A percentage mismatch alone does not diagnose a faulty charger or a degraded battery.
For a buying decision, compare realistic annual charging spending alongside purchase price and access to reliable charging. The Canadian EV incentive and affordability guide puts that running-cost question in the broader budget.
The takeaway: charging receipts measure purchased energy, while the battery gauge estimates stored charge. Understanding the difference makes cost comparisons more useful—and avoids mistaking every missing kWh for a billing fault.
FAQ
Why does a charger bill more kWh than my battery gains?
Some supplied energy is lost during conversion and charging, while some powers vehicle electronics or battery heating and cooling. The billed energy and the increase in stored battery energy are different measurements.
Does a 10% charging loss mean buying 10% more energy?
Not exactly. If 10% of incoming energy is lost, 90% is stored. Adding 45 kWh therefore requires 50 kWh of input, which is about 11.1% more than the stored energy.
Does preconditioning eliminate winter charging energy use?
No. Preconditioning can move battery-heating energy use to the drive before the stop. It can improve charging readiness and shorten the stop, but that heating still consumes energy.
Sources
- FuelEconomy.gov: Where the Energy Goes—Electric Cars
- ADAC: measured AC and DC charging losses, test conditions and preconditioning findings